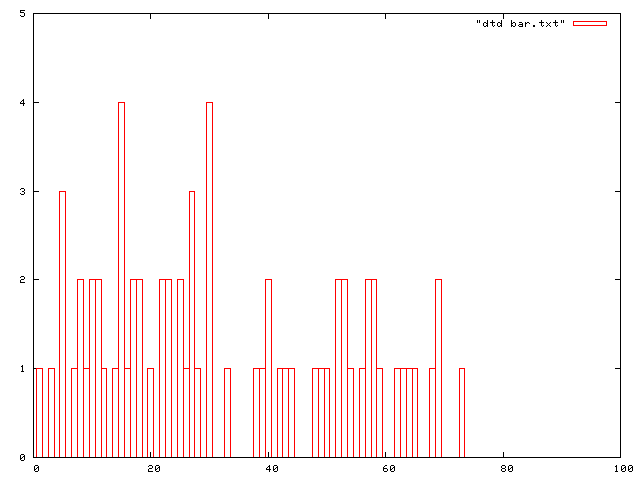
ある年の得点データの分布がこのようだったとする。
Terminal type set to 'x11'
gnuplot> set boxwidth 1
gnuplot> plot [0:100][0:10] "bar.txt" with boxes
gnuplot> set term png
Terminal type set to 'png'
Options are 'small color picsize 640 480 '
gnuplot> set output "bar.png"
gnuplot> replot
gnuplot> save "bar.plt"
gnuplot> quit
最後は念のために Gnuplot 形式で保存した。 グラフは次のようになる。